MEASURAND : End-of-cable open-circuit sensitivity
FREQUENCY : 15 MHz
- TRANSFER STANDARD : 1 mm hydrophone IP027
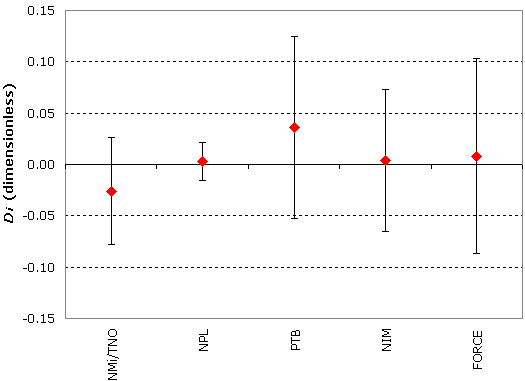
xi : result of measurement obtained by laboratory i
ui : combined standard uncertainty of xi
| Lab i |
xi
/ nV Pa-1 |
2ui
/ nV Pa-1 |
Date of measurement |
|
|
|
|
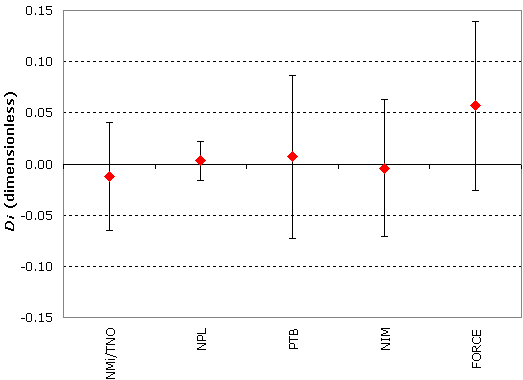
| NMi/TNO (1) |
224.3 |
14.3 |
Jan - Feb 2000 |
| NMi/TNO (2) |
237.7 |
14.3 |
| NPL |
244.6 |
7.6 |
May 1999, Aug 2001 and Aug 2003 |
| PTB |
252.8 |
22.8 |
Apr - May 2000 |
| NIM (1) |
139 |
13.6 |
Jun - Aug 2000 |
| NIM (2) |
213 |
20.9 |
| NIM (3) |
244.9 |
18.2 |
May 2003 |
| FORCE |
246 |
24.4 |
Sep - Nov 2000 |
(1): original data
(2): revised data after circulation
(3): data obtained from bilateral comparison, see Final Report
The values submitted by FORCE are obtained from a relative method of calibration.
TNO was under contract with NMi for ultrasound measurements at the time of the comparison.
|
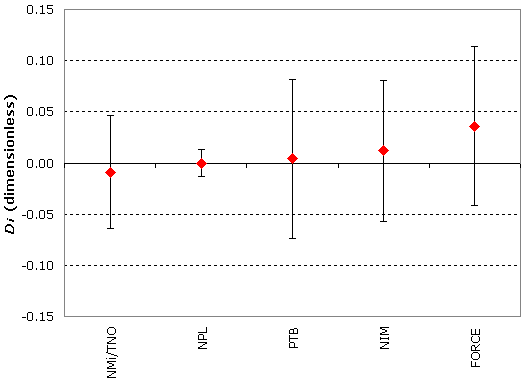
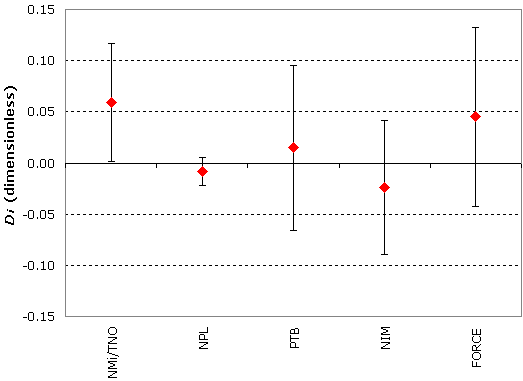
Results used for establishing equivalence |
- TRANSFER STANDARD : 1 mm hydrophone IP039
| Lab i |
xi
/ nV Pa-1 |
2ui
/ nV Pa-1 |
Date of measurement |
|
|
|
|
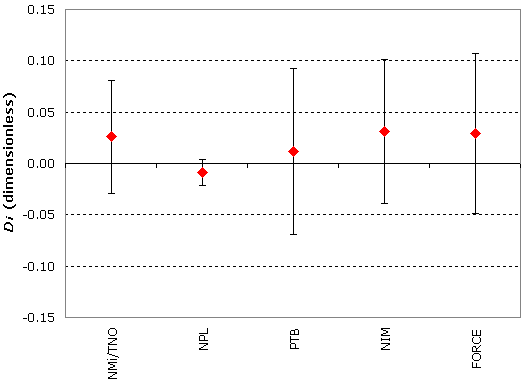
| NMi/TNO |
232.6 |
14.9 |
Jan - Feb 2000 |
| NPL |
258.7 |
10.3 |
May 1999, Aug 2001 and Aug 2003 |
| PTB |
265.2 |
22.8 |
Apr - May 2000 |
| NIM (1) |
169 |
15.7 |
Jun - Aug 2000 |
| NIM (2) |
259 |
24.1 |
| FORCE |
261 |
25.6 |
Sep - Nov 2000 |
(1): original data
(2): revised data after circulation, see Final Report
The values submitted by FORCE are obtained from a relative method of calibration.
TNO was under contract with NMi for ultrasound measurements at the time of the comparison.